
The Omitted Index: What a Missing Variable Reveals About Power and Wealth
The Omitted Index: What a Missing Variable Reveals About Power and Wealth
While civil rights institutions evaluate Black progress through economic and institutional metrics, they routinely bypass two fundamental sources of structural leverage: the defensive power of the marital home and the geographic leverage of demographic density.
"Numbers without structure are merely a crowd. But structure without numbers lacks the weight to command the room." Germar Reed
Every spring, civil rights leaders, policy analysts, and journalists assemble for the release of the National Urban League's annual State of Black America report. The document serves as an official scorecard for the community, evaluating progress across five core categories: economics, health, education, social justice, and civic engagement. Through its trademark Equality Index, the report measures how close Black Americans stand to full parity with white Americans across dozens of statistical indicators.
The 2026 edition continues this long tradition, highlighting persistent gaps in median wealth, homeownership rates, loan approval metrics, and executive board representation. Yet, for all its analytical detail, a careful reader quickly notices a striking omission. The report measures the downstream outputs of inequality while completely ignoring two foundational inputs that determine a group's long-term strength: the state of the Black marital household as an internal defensive shield, and the subtle, state-by-state political power that would exist had decades of demographic loss not occurred.
The Missing Column: The State of Black Marriage
It is impossible to conduct an honest evaluation of household wealth without discussing how households are formed and defended. The Urban League report correctly points out that the median wealth of white families remains significantly higher than that of Black families. However, by failing to include marital status within its primary Equality Index, the report treats wealth as an isolated economic outcome rather than a downstream result of household architecture.
To be clear, advocating for the intact family is not a denial of systemic racism, nor is it a naive suggestion that marriage alone eliminates historical oppression. Black families operate in a market conditioned by decades of redlining, predatory lending, wage disparities, and discriminatory commercial credit. Precisely because these external forces are hostile, the two-parent marital household serves as the primary, self-funded defensive shield available to the community.
The economic math is unforgiving. A two-parent, married household pools two potential incomes, shares fixed overhead costs, absorbs emergency financial shocks, provides internal childcare, and builds home equity at twice the rate of a single-parent household. Federal economic data confirms that the median net worth of married Black couples is nearly five times higher than that of single-parent Black households. In fact, Black married couples consistently achieve higher homeownership rates and lower poverty levels than the national average for all single-parent households regardless of race.
When civil rights organizations demand corporate wage adjustments and government housing subsidies without advocating for the restoration of the marital covenant, they are attempting to solve a structural problem with transactional tools. External policy reforms are vital, but their benefits cannot be retained by fragmented homes. You cannot bridge a wealth gap when 65 percent of children are born into single-income homes while competitor groups organize their capital around two-parent alliances. Marriage is not an arbitrary cultural preference or a substitute for justice: it is the ultimate self-funded economic defense unit.
The Unspoken Math of Political Power
The second major omission in the 2026 report involves demographic density and electoral leverage. The report features extensive chapters on voting rights, redistricting battles, and ballot access. Yet it completely avoids discussing the single largest factor shaping the size, weight, and geographic concentration of the Black electorate over the past half-century: the macro-demographic impact of federal abortion policy since 1973.
This analysis requires a clinical, macro-demographic perspective, completely separated from individual healthcare decisions, personal ethics, or moralization. At the level of statecraft and electoral math, political power is fundamentally a function of population volume and geographic density.
According to data from the Centers for Disease Control and Prevention and the Guttmacher Institute, Black women have consistently represented a disproportionate percentage of total abortions in the United States, accounting for roughly 35 to 40 percent of procedures while making up approximately 13.6 percent of the national population. This disparity was not created in a vacuum; it is the direct result of historical targeting. Early population control initiatives and eugenicist movements explicitly concentrated health infrastructure and family planning services in urban Black centers, creating healthcare deserts where access to comprehensive maternal care was starved while access to termination was subsidized.
The cumulative demographic result of this systemic targeting is staggering. Since the Supreme Court's 1973 Roe v. Wade decision, over 20 million Black lives have been terminated prior to birth. When including compounding generational growth, children and grandchildren who would now be entering adulthood, the Black population in the United States would today stand at approximately 65 to 70 million people, rather than its current 46.5 million. This would increase the Black share of the national population from 13.6 percent to nearly 20 percent.
The Electoral Map Reimagined
The political consequences of this demographic difference would be profound. In American politics, power is governed by geographic concentration. If abortion had never been legalized at the national level, the state-by-state political landscape would look completely different today, particularly across the American South and major urban corridors.
Critics often argue that Black Americans are not a political monolith, pointing out that a larger Black population would contain diverse ideological views, ranging from traditional social conservatives to progressive reformers. This internal diversity is real and healthy. However, the mathematical mechanics of American elections do not require ideological uniformity to grant structural leverage. Under the rules of "minimum viable coalitions," when a demographic group reaches 40 to 55 percent of a state's electorate, it establishes an unshakeable veto-bloc or absolute legislative majority.
Consider what electoral maps and state legislatures would look like under these preserved demographic conditions:
State-by-State Demographic Footprint Analysis
Current Black Population Share vs. Projected Preserved Demographic Share
| State / Region | Current Black Share | Projected Preserved Share | Political Power Shift |
|---|---|---|---|
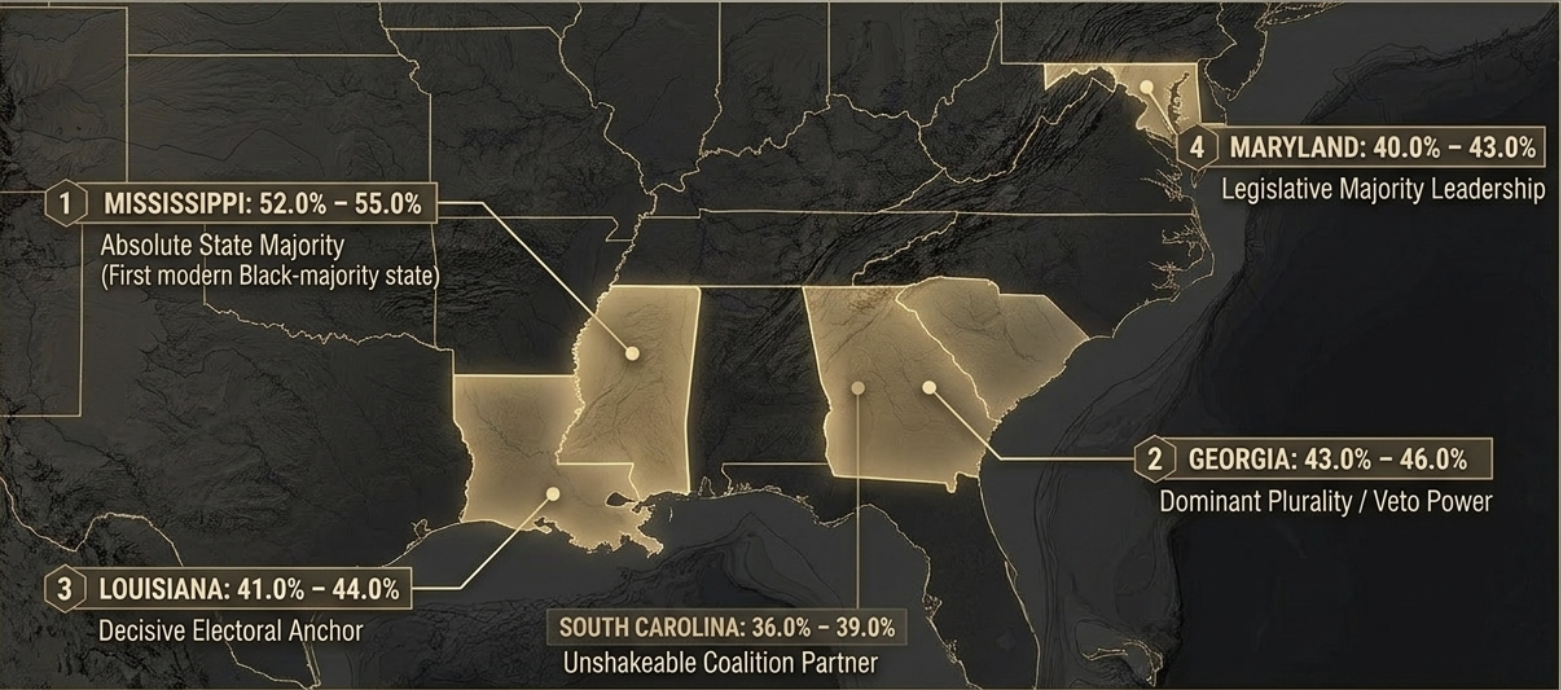
| Mississippi | 38.0% | 52.0% – 55.0% | Absolute State Majority |
| Georgia | 33.0% | 43.0% – 46.0% | Dominant Plurality / Veto Power |
| Louisiana | 31.5% | 41.0% – 44.0% | Decisive Electoral Anchor |
| South Carolina | 26.5% | 36.0% – 39.0% | Unshakeable Coalition Partner |
| Maryland | 31.0% | 40.0% – 43.0% | Legislative Majority Leadership |
| North Carolina | 22.0% | 30.0% – 33.0% | Statewide Balance Holder |
In Mississippi, the Black population would have crossed the 50 percent mark, creating the first Black-majority state in the modern nation. In Georgia, Louisiana, and Maryland, Black voters would make up over 40 percent of the electorate. In states like South Carolina, Alabama, and North Carolina, the Black voting bloc would be large enough that no candidate from either major political party could win a statewide election without explicit, written commitments to Black interests.
Under this reality, political candidates could not treat Black voters as a reliable constituency to be taken for granted or appeased with symbolic gestures. Instead, governors, senators, and state legislators from all parties would have to actively petition Black communities for permission to pass laws or govern effectively. The balance of power would permanently shift from political dependence to strategic control.
The Power Vacuum and Strategic Realignment
When a demographic group's numerical weight is artificially flattened, political influence does not disappear into thin air. It is absorbed by competing interest groups. In American electoral strategy, political parties constantly calculate the minimum viable coalition needed to achieve power. When the Black population was held at 13.6 percent rather than reaching its potential 20 percent national footprint, two primary groups stepped in to fill the resulting political vacuum:
- Suburban Swing Demographics: National campaign strategists shifted their primary focus toward suburban swing voters. To appeal to this constituency, both major political parties prioritized tax cuts, capital gains protections, and suburban infrastructure spending, while starving urban centers and rural Black communities of capital investment.
- Corporate Donor Networks: Because Black voters were geographically capped below majority thresholds across Southern states, statewide candidates did not need to build grassroots, community-funded coalitions. Instead, they relied on corporate political action committees and wealthy donor networks, effectively handing policy control over to financial interests.
As a result, Black voters became a "captured electorate." One political party treated Black support as a guaranteed baseline requiring minimal structural investment, while the opposing party viewed the Black vote as a demographic threat to be neutralized through aggressive redistricting and voter restrictions. Without numerical majorities, Black political leverage was reduced to symbolic representation rather than direct economic control.
The Financial Downstream: Laws Passed in the Void
"Policy benefits cannot be retained by fragmented homes. External political leverage and internal household structure must advance together to protect community capital." Anticipating Pushback: Policy Impact on Wealth Retention
What did this missing political leverage actually cost in real dollars? When a demographic group loses its ability to form a veto-bloc in state legislatures, bad policy passes without financial resistance. Had preserved Black voting majorities (40% to 55%) existed across Mississippi, Georgia, Louisiana, South Carolina, and Maryland over the past thirty years, four major wealth-draining policy regimes could never have passed in their historical form. Putting a hard balance-sheet figure on these policies reveals the staggering financial toll of the political void:
-
Mass Incarceration & The Carceral Wealth Drain:
Estimated Cumulative Cost: $3.5 Trillion to $5.0 Trillion in Lost Lifetime Earnings & Equity
Federal and state crime legislation—including mandatory minimums and the 1994 Crime Bill—removed millions of working-age Black men from their households during their prime earning years. Beyond the immediate $348 billion annual "family tax" paid out-of-pocket for visitation, phone markups, and legal debts, studies by the Brennan Center for Justice and FWD.us demonstrate that criminal records reduce subsequent lifetime earnings by 52%. Over a 30-year span, this policy drained over $3.5 trillion in cumulative wage capacity and home equity directly out of Black neighborhoods, collapsing local property values and leaving single mothers to bear 100% of household overhead alone. -
1996 Welfare Restructuring (PRWORA) & Safety-Net Diversion:
Estimated Cumulative Cost: $60 Billion to $75 Billion in Diverted Direct Aid
The replacement of Aid to Families with Dependent Children (AFDC) with block-granted Temporary Assistance for Needy Families (TANF) allowed state legislatures to divert safety-net dollars into administrative slush funds and third-party programs. Nationally, less than 21% of TANF funds reach families as direct cash assistance today. Across Southern states, state legislatures routinely redirected over $2.1 billion annually away from direct family stabilization. Over three decades, an estimated $60 billion to $75 billion in direct cash support that could have shielded struggling mothers, subsidized childcare, and incentivized family preservation was stripped out of low-income Black households. -
Hyper-Local Property Tax School Funding Disparities:
Estimated Cumulative Cost: $23 Billion Annual Gap ($690 Billion Cumulative)
State laws that tie public school funding strictly to local property tax bases ensure that Black children receive structurally underfunded educational infrastructure. Landmark studies by EdBuild reveal that non-white school districts receive $23 billion less per year than majority-white districts serving the exact same number of students—amounting to an average gap of $2,226 per student every single year. Over thirty years, this educational capital starvation represents a $690 billion drain in facility investment, STEM infrastructure, and teacher compensation that state majorities would have equalized by law through statewide revenue pooling. -
State Procurement & Public Contracting Exclusion:
Estimated Cumulative Cost: $3.0 Trillion+ in Missed Commercial Capital
State development grants, highway infrastructure dollars, and municipal procurement budgets routinely bypass Black-owned commercial enterprises. While Black Americans represent 13.6% of the national population (and up to 35–55% in Southern states), Black-owned firms receive a meager 1.5% to 2.0% of state and federal contracting dollars. Disparity studies estimate this gap costs Black enterprise between $100 billion and $150 billion per year in missed commercial revenue. Over a 30-year period, more than $3 trillion in public commercial capital was routed into suburban and corporate firms instead of building Black business equity and high-wage local employment.
Reclaiming Both Family and Future
When institutions like the National Urban League present their reports, they offer valuable data on the immediate economic conditions facing our communities. But true leadership requires looking beyond current indicators to evaluate the deeper foundations of lasting power.
Political power is not gifted by federal legislation or corporate promises. It is built through numerical density, geographic concentration, and disciplined household organization. A community that preserves its children, honors the covenant of marriage, and builds two-parent homes creates an environment that naturally commands economic capital and political respect.
If we want the State of Black America to reflect true self-determination in the years ahead, we must stop ignoring the fundamental pillars of our strength. We must rebuild our families at home while recognizing the true weight of our demographic presence across the land. When our homes are intact and our numbers are strong, we will no longer need to ask for a seat at the table: our presence will define the room.